How to Use Technical Analysis in Cryptocurrency Investment
Cryptocurrency investing has become increasingly popular over the years, with more and more people looking for ways to make a profit from this rapidly changing market. One key strategy that many successful investors use is technical analysis, which involves studying charts and patterns to predict future price movements. In this article, we’ll take a closer look at how to use technical analysis in cryptocurrency investment.
Before we dive into the details of technical analysis, it’s worth noting that investing in cryptocurrencies carries inherent risks, including market volatility and regulatory uncertainty. As with any investment strategy, it’s essential to do your own research and consider seeking professional advice before making any investment decisions.
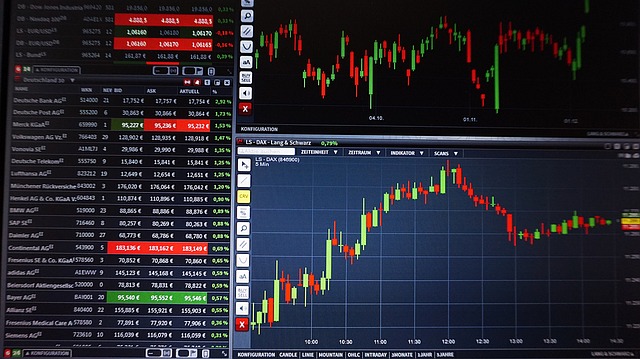
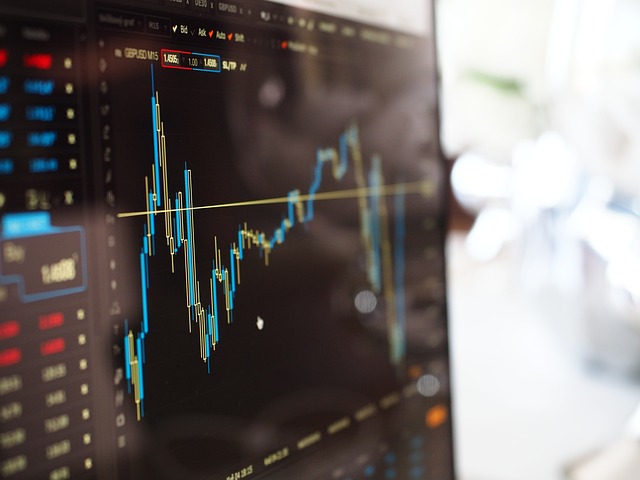
The first step in using technical analysis for cryptocurrency investing is to understand the basics of chart patterns and indicators. Some common charts used by technicians include candlestick charts, line charts, and bar charts. Each type of chart provides different insights into market trends and can be used to identify potential price movements.
Choosing the Right Technical Indicators
Technical indicators are mathematical formulas that help analysts determine whether a security is overbought or oversold based on its recent price movement. There are many types of technical indicators, but some of the most popular ones used in cryptocurrency analysis include:
- Moving Averages – Moving averages are a type of trend indicator that help analysts identify trends and potential price movements.
- Relative Strength Index (RSI) – The RSI is a momentum oscillator used to measure the velocity of price changes.
- Bollinger Bands – Bollinger Bands are a volatility indicator that help analysts identify potential breakouts and trend reversals.
- Stochastic Oscillator – The Stochastic Oscillator is a momentum indicator used to measure the relationship between a security’s price and its price range.
In addition to these technical indicators, many analysts also use more advanced tools such as algorithmic trading strategies and automated trading systems. These tools can help identify potential price movements and automate trades based on specific conditions.
Reading Technical Charts
Once you have chosen the right technical indicators for your cryptocurrency analysis, it’s time to start reading technical charts. Here are some key things to look for when analyzing a chart:
- Trend lines and trend channels – Trend lines and trend channels help analysts identify trends and potential price movements.
- Pivot points and key levels – Pivot points and key levels are important support and resistance levels that can be used to predict price movements.
- Candlestick patterns – Candlestick patterns such as hammering, shooting stars, and engulfing reversals can help analysts identify potential price movements.
- Support and resistance levels – Support and resistance levels are critical levels that can be used to predict price movements.
In addition to these key elements, many analysts also use more advanced chart analysis techniques such as:
- Chart patterns and formations – Chart patterns and formations can help analysts identify potential price movements.
- Ichimoku Cloud analysis – Ichimoku Cloud analysis is a comprehensive chart analysis technique that helps analysts identify trends, support, and resistance levels.
- Head and shoulders reversal patterns – Head and shoulders reversal patterns can help analysts identify potential trend reversals.


