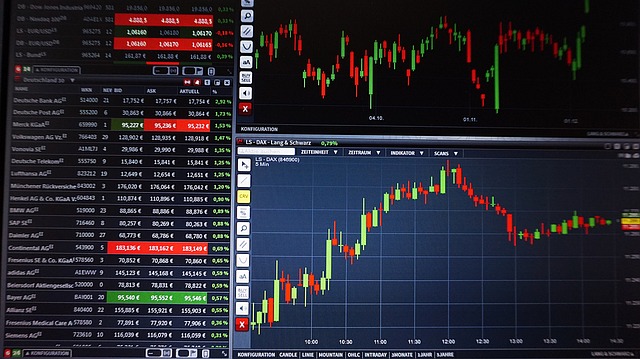
How to Use Technical Analysis in Cryptocurrency Investment
Cryptocurrency investing can be a high-risk, high-reward endeavor. With the vast and rapidly changing landscape of cryptocurrencies, it’s essential to have a solid understanding of technical analysis to make informed investment decisions. In this article, we’ll delve into the world of technical analysis and explore its key concepts, indicators, and strategies for successful cryptocurrency investing.
Technical analysis is a method of evaluating securities by analyzing statistical patterns and trends in their prices and volumes. It’s based on the idea that past market data can be used to make predictions about future price movements. In the context of cryptocurrency investing, technical analysis provides a framework for identifying potential trading opportunities, understanding market sentiment, and adjusting investment strategies accordingly.
Understanding Technical Indicators
Technical indicators are mathematical formulas that help analysts identify trends, patterns, and other market characteristics. They’re used to generate buy and sell signals based on specific criteria, such as price movements, volume, and volatility.
- Key Indicators for Choosing a Cryptocurrency Exchange
- Some popular technical indicators include moving averages (MA), relative strength index (RSI), Bollinger Bands, and the MACD (moving average convergence divergence).
- Moving averages can help identify trends by smoothing out price fluctuations. RSI measures the level of bullishness or bearishness in a market, while Bollinger Bands provide a measure of volatility. The MACD is a momentum indicator that helps analyze the relationship between two moving averages.
Identifying Trends and Patterns
Trends and patterns are essential components of technical analysis. By identifying these, analysts can anticipate future price movements and make informed investment decisions.
- There are three main types of trends: uptrend, downtrend, and sideways trend. An uptrend is characterized by a rising price, while a downtrend features a falling price. A sideways trend indicates a stable price range.
- Patterns, on the other hand, refer to specific chart shapes or formations that can predict future price movements. Some common patterns include head and shoulders, inverse head and shoulders, and triangles.
Using Technical Analysis in Cryptocurrency Trading
Technical analysis is a powerful tool for cryptocurrency traders. By analyzing charts, identifying trends and patterns, and using technical indicators, traders can make informed decisions about buy and sell orders.
- Pros and Cons of Investing in Altcoins
- When using technical analysis, it’s essential to consider multiple time frames. This allows traders to identify patterns and trends at different levels of the market.
- It’s also crucial to combine technical analysis with fundamental analysis. Fundamental analysis examines a cryptocurrency’s underlying value, such as its use case, development team, and market position.
Conclusion and Final Tips
In conclusion, technical analysis is a valuable tool for cryptocurrency investors. By understanding key concepts, indicators, and strategies, investors can make informed decisions about buy and sell orders. Remember to combine technical analysis with fundamental analysis and consider multiple time frames when making investment decisions.
Finally, always do your own research and never invest more than you can afford to lose. With the right knowledge and approach, technical analysis can help you navigate the complex world of cryptocurrency investing.
Technical Analysis: What It Is and How to Use It in Investing provides a comprehensive overview of technical analysis and its applications in investing. For more information on technical indicators and patterns, visit Technical analysis – Wikipedia.


